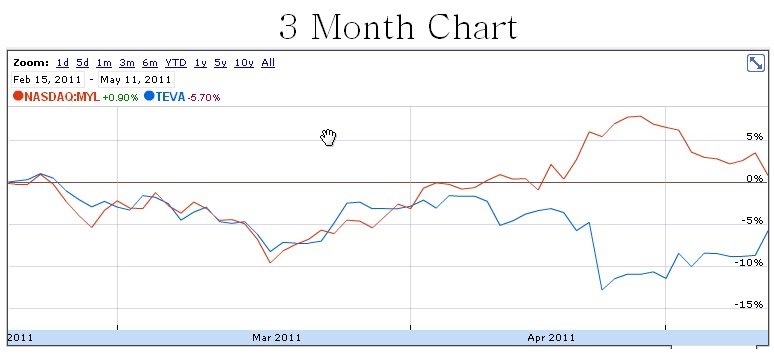
I am not an expert trading stocks based on chart patterns, but I came across an interesting possible pattern of stock prices of Teva and Mylan. They are the 2 biggest generic manufacturers and are competitors and it makes sense that a decrease in the price of one stock would show an increase in the other. It also makes sense that these stocks may move in the same direction for reasons larger than the two companies.
The 3 month chart shows that from mid-February to end of March, both stocks have similar charts. As seen in the 5 day and 1 month charts, Teva and Mylan have been moving in opposite directions, almost at the same rate, for the past month. They appear to be mirror images. Perhaps this can be exploited by investors. Any thoughts or suggestions?

No comments:
Post a Comment